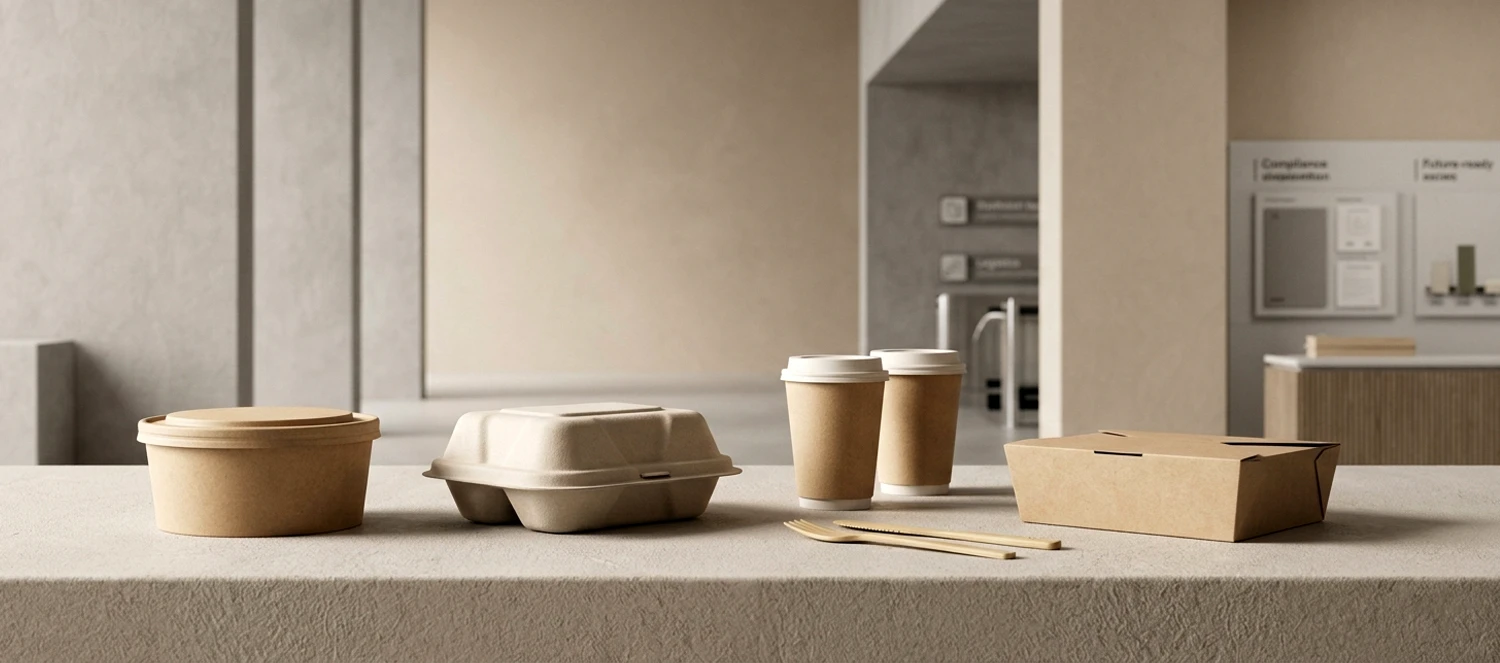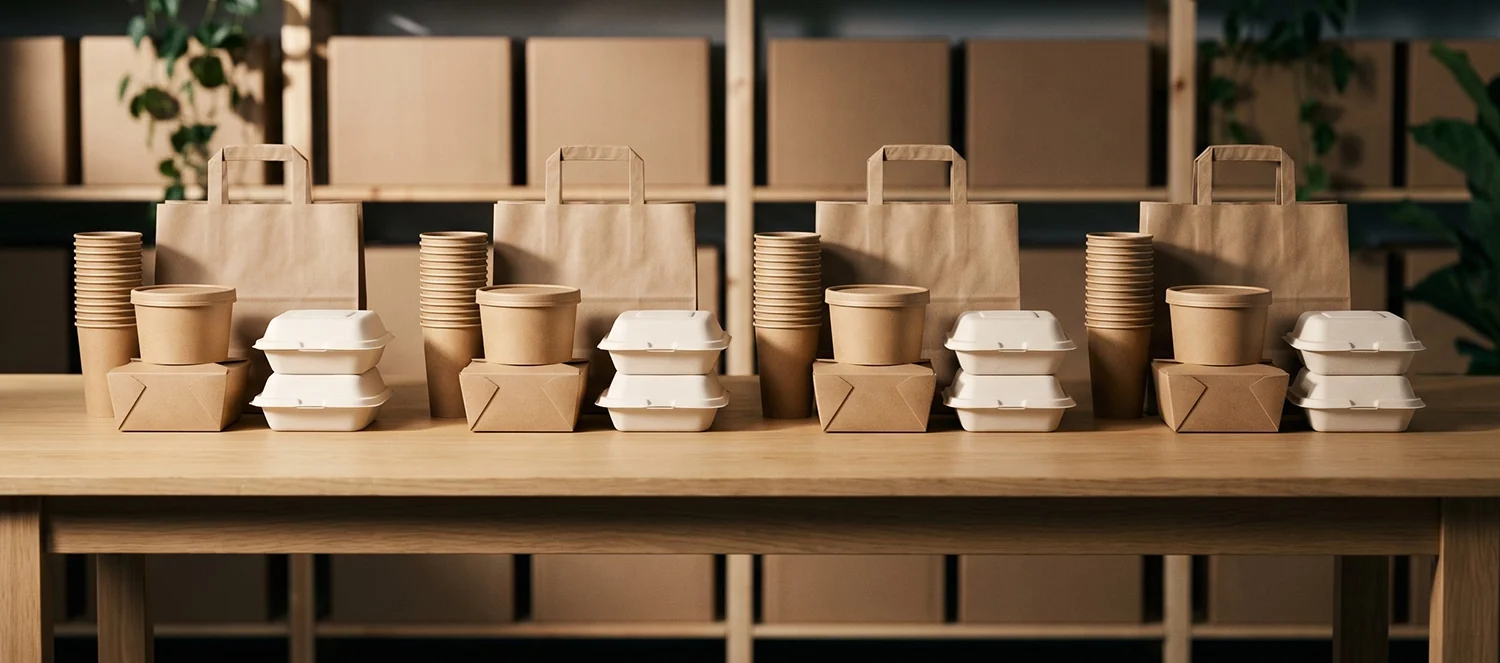
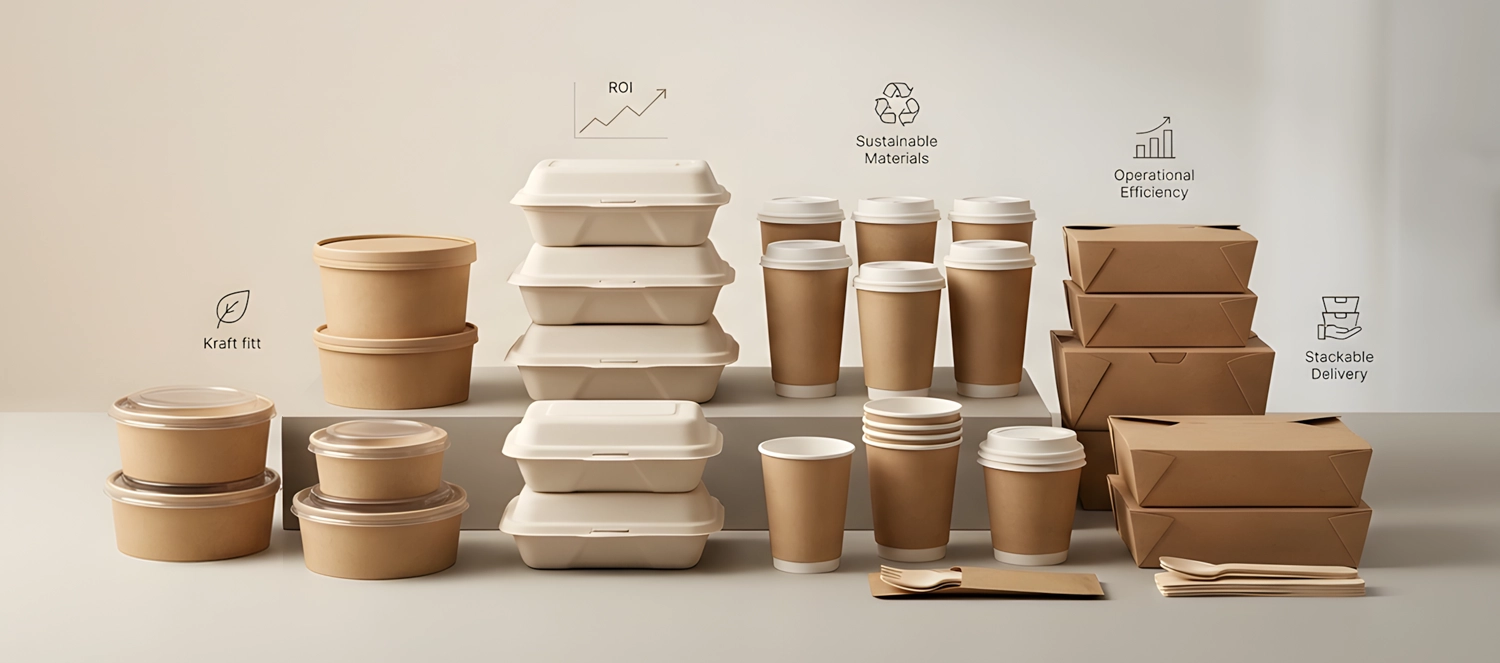
Sustainable packaging ROI in horeca operations is a topic that gets discussed in broad terms and rarely with the specificity that makes it actionable. This guide takes a different approach: rather than arguing that sustainable packaging “creates value,” it shows where that value comes from, in which cost categories it appears, and how to calculate whether a packaging change is financially justified for your specific operation.
The analysis covers the four primary ROI dimensions of sustainable packaging decisions in European horeca markets: direct cost comparison (including plastic taxes and EPR), operational efficiency, compliance risk reduction, and commercial positioning. Each dimension has measurable elements. The goal is a framework you can apply to your own operation rather than a generic endorsement of sustainability investment.
For the direct cost comparison with specific market-by-market tax rates, see: Sustainable Packaging Cost Analysis. For the procurement framework, see: Horeca Packaging Procurement Guide.
ROI Dimension 1: Direct Cost — The Numbers That Actually Move
The most common objection to sustainable packaging is unit cost: eco-friendly alternatives cost more per unit than conventional plastic packaging. This is often true at the unit purchase price level. It is frequently false at the total system cost level when all relevant cost components are included.
The Components That Make the Calculation Work Differently
Plastic Packaging Taxes
Plastic-specific charges differ by market. The UK Plastic Packaging Tax (£223.69 per metric ton from 1 April 2025, £228.82 from 1 April 2026) applies to packaging components that are mostly plastic by weight with less than 30% recycled plastic. Spain taxes the plastic content of non-reusable packaging at €0.45/kg (since 2023). Germany has no plastic packaging tax, but producers of single-use plastic cups, their lids and food containers pay into the Single-Use Plastics Fund (Einwegkunststofffonds). Portugal charges €0.30 per single-use plastic or aluminium take-away ready-meal package. Italy’s plastic tax is postponed to 2027, and France relies on eco-modulated EPR fees rather than a plastic tax. For a café using PE-lined cups with separate plastic lids, the lid is the clearest target. As an illustration for Spain (example weights, not Ekoroll data):
- A separate plastic lid weighing approximately 5 grams carries about €0.0023 in plastic tax. The PE lining of a cup adds tax only on its plastic weight, typically a small fraction of the cup.
- At 9,000 serves per month: roughly €20 per month in tax on lids alone, about €245 per year, on top of the purchase cost of the lids.
- Lid-free cups remove the lid and its tax. Whether the coated cup body counts as containing plastic depends on the coating chemistry and national classification: water-based dispersion coatings can also be polymers, so confirm the cup’s classification with your scheme rather than assuming zero.
The Lid Cost Elimination
Switching to lid-free cups eliminates the separate plastic lid cost entirely. At 9,000 cups per month, that is 9,000 lids a month that no longer need to be bought, stored and reordered. A lid-free cup carries a moderate unit cost premium over a plain cup — the difference depends on format, volume and print, and pricing is quoted per project — but that premium is often largely offset by lid cost elimination before any plastic-specific charges are included in the comparison.
EPR Fee Differences
Extended producer responsibility (EPR) fees apply to all packaging, including paper and bagasse: in Germany, for example, every packaging item needs LUCID registration and VerpackG system participation. What changes with the material is the fee rate, which in eco-modulated schemes is higher for less recyclable formats, and the extra single-use-plastic layer: plastic cups, lids and food containers covered by the Single-Use Plastics Directive carry additional EPR costs. These costs are often not itemized in supplier invoices, but they are real. Switching material changes the fee category; it does not remove the obligation.
The Net Direct Cost Position
For operations in markets with plastic-specific charges, the realistic total system cost comparison between conventional and alternative packaging formats shows:
| Format Change | Unit Cost Premium | Plastic-Specific Charge Saving | Net Total System Cost |
|---|---|---|---|
| Lid-free WB cups vs PE cups + plastic lids | Moderate premium on the cup; no lid to buy | Lid charge removed; cup body per national classification | Often close to cost-neutral |
| Bagasse containers vs plastic food containers | Higher; quoted per project | Plastic tax or SUP levy on the container avoided | Net premium reduced in markets with these charges |
| Wooden cutlery vs plastic cutlery | Higher; quoted per project | Not applicable | Mandatory — plastic cutlery banned under SUP |
| Molded fiber lids vs plastic cup lids | Higher; quoted per project | Lid plastic tax or SUP levy avoided | Net premium reduced in markets with these charges |
| PFAS-free greaseproof paper vs conventional | Comparable unit cost | No plastic tax difference | Effectively cost-neutral; PFAS limits apply under PPWR from 12 August 2026 |
The direct cost ROI of sustainable packaging varies significantly by format and market. For cup formats, removing the lid frequently brings the switch close to cost-neutral. For food containers, there is typically a genuine cost premium that must be justified by other ROI dimensions. For cutlery, the question is moot — plastic is not legal.
ROI Dimension 2: Operational Efficiency — Where Hidden Costs Live
Operational efficiency is the ROI dimension most consistently underestimated in packaging procurement analysis. The reason is that operational costs caused by packaging failures appear in different budget categories from packaging procurement — delivery refunds appear in customer service budgets, staff time appears in labor costs, storage inefficiency appears in facilities costs — and the connection to packaging quality is not always made explicitly.
Delivery Complaint and Refund Cost
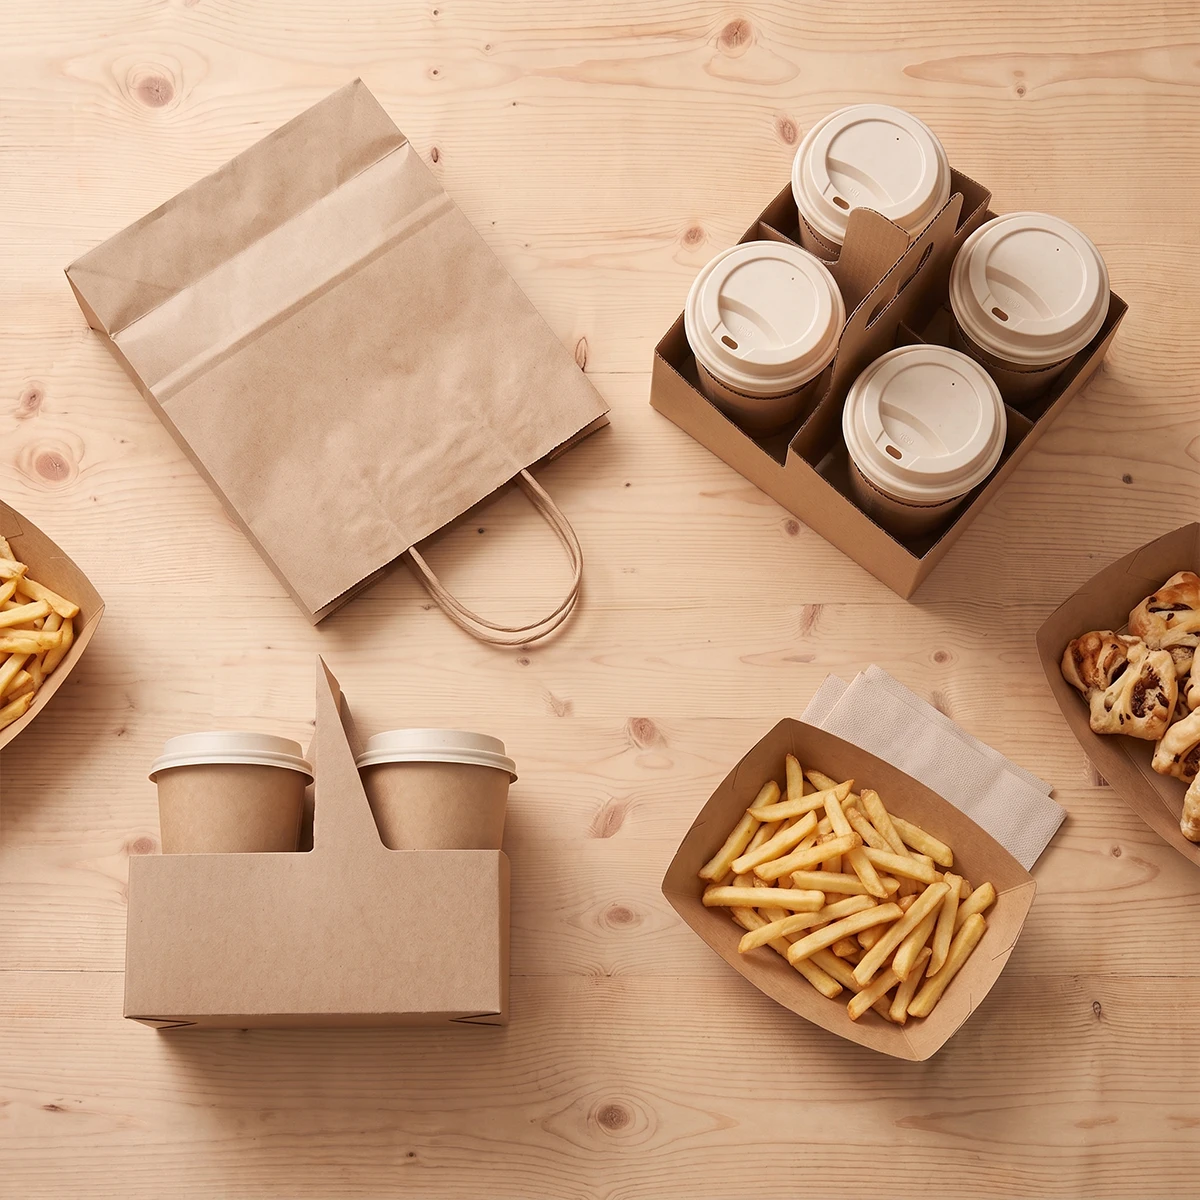
The relationship between packaging quality and delivery complaint rates is direct and measurable. Food delivery platform data consistently shows that packaging-related complaints (leakage, temperature loss, presentation damage) make up a significant share of negative delivery reviews. As an illustration, for a restaurant processing 100 delivery orders per day at an average order value of €22:
- If packaging failures affect 3 percent of orders: 3 orders per day × €22 = €66 per day in refund or replacement cost
- Monthly cost of 3 percent delivery failure rate: approximately €2,000
- If better packaging reduces failure rate from 3 percent to 1.5 percent: €1,000 per month saving
- Annual saving: approximately €12,000
This calculation is conservative — it includes only direct refund cost, not the revenue loss from customers who do not reorder after a negative delivery experience (a meaningful share of customers who complain about packaging do not come back) or the platform rating impact on organic order volume.
Staff Time and Packaging Workflow
Packaging system complexity directly affects packing speed and error rate. Operations using five or more container SKUs where the correct container for each menu item requires judgment create consistent packing errors and slower pack speeds during peak periods. A reduction from five to three container SKUs — achievable for most standard menus — shortens packing time per order during peak periods. At high peak volumes, even a small time saving per order adds throughput capacity without additional staffing — a labor saving that never appears in the packaging cost line.
Inventory Management and Stock-Out Risk
Two-component cup systems (cup plus lid) create inventory risk that single-component lid-free systems remove: lid stock-outs halt service for all cups even when cup stock is adequate. For a café running two cup sizes with separate lids, this is four SKUs with four independent stock-out risks. Switching to lid-free cups halves the SKU count to two. The operational value of stock-out risk elimination is difficult to quantify precisely but represents real service continuity value for high-volume operations. See: Food Delivery Packaging Mistakes.
Storage Efficiency
Packaging storage requirements have a direct cost in kitchen and counter space. Lid inventory requires separate storage sections adjacent to cup storage. Single-component lid-free cup systems substantially reduce the storage space needed at the cup station. In dense urban café environments where back-of-house space is expensive, even a small reduction in packaging storage area is a real, if implicit, facility cost saving.
ROI Dimension 3: Compliance Risk Reduction
Compliance risk is the ROI dimension with the most asymmetric profile: the annual cost of maintaining compliant packaging is relatively small, while the cost of a compliance failure — enforcement action, customer claim, account loss — can be disproportionately large.
Single-Use Plastics Rules: Pressure on Cups, Lids and Containers
Separate snap-on plastic lids on coffee cups are not illegal. The EU tethered-cap rule (in force since 3 July 2024) applies to caps and lids of beverage containers up to 3 liters, such as bottles and composite beverage cartons, not to cups. What does apply to plastic cups and their lids under Directive (EU) 2019/904 is a different set of measures: member states must reduce their consumption (for example Germany’s obligation for larger take-away outlets to offer a reusable option), cups made wholly or partly of plastic must carry the SUP marking, and producers pay extended producer responsibility costs, in Germany through the Single-Use Plastics Fund. These measures tend to tighten over time, and customers increasingly ask for alternatives. The cost of a reactive change (when a national measure, a levy increase or a key customer forces it) is typically higher than the cost of a planned transition:
- Proactive transition: planned stock run-down, orderly format switch, staff training, customer communication — manageable cost with no surprise element
- Reactive transition: emergency format sourcing (typically at higher cost due to short lead times), potential stock write-off of formats a customer or regulation no longer accepts, disrupted operations during unplanned changeover
PPWR Forward Compliance
The PPWR (Regulation (EU) 2025/40) entered into force on 11 February 2025 and applies from 12 August 2026. PFAS limits for food-contact packaging apply from that date; design-for-recycling criteria, harmonized labels and reuse targets follow in stages from 2028 to 2030. The detailed recyclability criteria for paper cups are still being set, so no coating can claim to be “PPWR-compliant for recyclability” today. Cups with a water-based, PFAS-free, PE-free coating are designed for paper recycling where local collection accepts them, and they meet the PFAS limits by design, which puts them in a stronger position than PE-lined cups. A planned transition avoids the stock write-offs, rush sourcing and disruption of a reactive one, and the saving grows with operation size.
Environmental Claims Liability Avoidance
Since 27 September 2026, Directive (EU) 2024/825 (Empowering Consumers for the Green Transition) bans generic environmental claims such as “eco-friendly” or “green” without recognized excellent environmental performance, “climate neutral” product claims based on offsetting, and sustainability labels not based on a certification scheme or set by public authorities. (The separate Green Claims Directive proposal was not adopted; in June 2025 the Commission announced its intention to withdraw it.) Operations describing PE-lined cups with plastic lids as “eco-friendly cups” need to replace that wording with specific, documented statements, such as “water-based, PFAS-free, PE-free coating, no plastic lid”, or stop making the claim. The cost of a claims complaint is disproportionate to the cost of getting the packaging and the documentation right. See: EU Plastic Ban Explained and PFAS-Free Paper Cups Guide.
ROI Dimension 4: Commercial Positioning
Commercial positioning ROI is the most variable dimension — it depends heavily on market, customer segment and competitive context. In some markets and segments it is the largest ROI driver. In others it is secondary. The honest assessment requires knowing your specific market.
Consumer Willingness to Pay Premium
Surveys in European café and food service markets suggest that many urban customers associate packaging with less plastic with higher perceived quality, and some say they are willing to pay a little more for beverages served in cups with a PE-free coating and no plastic lid. For a busy café, even a small menu price uplift on a share of serves can add up to meaningful additional monthly revenue from premium perception alone. Test it on your own menu and customer base before relying on it.
B2B Account Qualification
Corporate catering accounts, hotel groups, public sector food service and event catering clients increasingly specify reduced-plastic packaging and documented materials as a procurement qualification criterion. A café or food service operator who can supply with that documentation can qualify for these accounts; a competitor who cannot may be excluded. The revenue from a single corporate lunch contract can exceed the additional packaging cost of a year of operations at many café scales. See: Eco-Friendly Takeaway Packaging Guide for Horeca Distributors.
Platform and Review Impact
On food delivery platforms, packaging that performs well supports positive customer reviews, and ratings influence how visible a restaurant is in the app. Better visibility can mean more orders without additional marketing spend. The value of a rating improvement is platform-specific, so track your own order data before and after a packaging change.
Building Your Operation-Specific ROI Case
The ROI case for sustainable packaging is not universal — it depends on your operation’s specific profile. Use this framework to build the calculation for your context:
Step 1: Quantify Direct Cost Position
Calculate current plastic-specific charges (plastic taxes, single-use plastic levies) on cup, lid and container formats in each market you operate. Calculate current lid cost per month. Compare EPR fees for the current and alternative materials. Run the total system cost comparison including these figures. This typically shows whether the direct cost case is positive, neutral or negative for your specific formats and volumes.
Step 2: Estimate Operational Efficiency Gains
Review your last three months of delivery complaint data. Estimate what percentage are packaging-related. Assign a refund cost to each. This gives you a baseline operational cost that better packaging can reduce. Assess your current packaging SKU count and whether consolidation is feasible.
Step 3: Assess Compliance Risk Exposure
Check which single-use plastic measures apply to your cups, lids and containers in each market (marking, consumption-reduction measures, levies such as Germany’s Single-Use Plastics Fund). Check your barrier specifications against the PPWR PFAS limits that apply from 12 August 2026, and follow the recyclability criteria due from 2028 to 2030. Check your environmental claims: since 27 September 2026, generic claims you cannot document are banned under Directive (EU) 2024/825.
Step 4: Assess Commercial Positioning Value
Identify whether any of your current or target customers specify reduced-plastic or documented packaging as a procurement requirement. Identify whether your competitive market rewards visible, documented packaging choices. Assess your review and rating data for packaging-related comments.
The output of these four steps gives you an operation-specific ROI case that is far more actionable than generic claims about sustainable packaging value.
Build Your Sustainable Packaging ROI Case with Ekoroll
Ekoroll supplies complete food packaging systems wholesale to horeca operators and distributors across Europe: cups with a water-based, PFAS-free, PE-free coating, bagasse containers (home compostable & 100% bagasse, TÜV AUSTRIA OK compost HOME; certificate held by the producing mill, copy on request), molded fiber lids and wooden cutlery, all with product documentation. Supplied from Türkiye. Minimum quantities and lead times are quoted per project. Contact us with your current packaging specification and monthly volumes for a total system cost comparison.