Packaging cost reduction in horeca operations is a topic with a lot of general advice and very little practical specificity. “Standardize your packaging” and “consolidate your suppliers” are correct recommendations — but they don’t tell you how to actually do it, what the specific savings look like, or where to start when you have a functioning operation you can’t shut down to redesign from scratch.
This guide takes a different approach. It covers five specific, actionable tactics that horeca businesses use to reduce packaging costs in practice — with the mechanics of each tactic, realistic savings estimates and the sequence in which to implement them. These tactics apply whether you operate a single café, a chain of restaurants or a food delivery kitchen.
For the financial analysis of sustainable packaging costs including plastic taxes and EPR, see: Sustainable Packaging Cost Analysis. For the complete ROI framework, see: Sustainable Packaging ROI for Horeca Businesses.
Tactic 1: Run a SKU Audit and Eliminate Redundant Formats
The single most common source of unnecessary packaging cost in horeca operations is SKU proliferation — too many container and cup formats serving the same or overlapping functions. This happens gradually: a new menu item gets its own container, a delivery format gets added without retiring the café format, a supplier switch adds a slightly different size that never fully replaces the old one. Over time, operations accumulate five, seven, ten container SKUs where three or four would cover the same menu.
What SKU Proliferation Actually Costs
Every unnecessary SKU has a cost beyond its unit price:
- MOQ lock-in: each SKU requires its own minimum order quantity. Slow-moving SKUs tie up working capital in stock that turns over slowly. As an illustration (MOQs vary by supplier and format): a café using 300 units per month of an occasional-use container with an assumed 5,000-unit MOQ has 16 months of stock on order at any given time — that’s cash locked in packaging rather than operations.
- Storage space: each SKU requires dedicated storage space. In dense urban café environments, back-of-house storage space has real value. Ten container SKUs taking up 6 square meters costs significantly more than five SKUs taking up 3 square meters when that space could be used for product storage, equipment or staff workflow.
- Packing errors and training: every additional SKU increases the probability of packing errors (wrong container for a menu item) and the training time required for new staff. Packing errors in delivery operations create customer complaints — each complaint has a direct refund cost and an indirect repeat-order loss cost.
- Reorder management: each SKU requires independent reorder monitoring, stock level checking and purchase order management. For operations managing ten container SKUs, this is ten independent procurement cycles rather than four.
How to Run the Audit
List every packaging SKU currently in use with three data points: monthly consumption volume, unit cost and total monthly spend. Then group by function: which SKUs serve the same or comparable food types? For most standard horeca menus, the functional coverage breaks down to: small container, medium container, large container, soup/bowl format, hot beverage cup, cold beverage cup, wrapper format. Seven functional categories covers most menus. If you have more SKUs than functional categories, you have consolidation potential.
Realistic Saving
Reducing from eight container SKUs to four can save a meaningful share of total packaging procurement cost through improved volume pricing on consolidated SKUs, reduced storage cost and eliminated slow-mover capital lock-in — from format consolidation alone, before any format change or supplier switch.
Tactic 2: Switch to Lid-Free Cups and Eliminate the Lid SKU
For café and coffee operations, the cup-and-lid system is a two-SKU procurement unit masquerading as one product decision. Every cup size requires a matching lid SKU — typically purchased from the same or a different supplier, managed separately, stored separately and reordered independently. Switching to lid-free cups converts a two-SKU system into a one-SKU system for each cup size.
The Direct Savings Calculation
For a café using 4,000 cups per month across two sizes:
- Lids bought per month today: 4,000
- Lids bought per year: 48,000
That entire lid line disappears when switching to lid-free cups — before any plastic tax saving is included. A lid-free cup carries a moderate unit cost premium over a plain cup; the difference depends on format, volume and print, and pricing is quoted per project. In most comparisons, the lid purchase cost that disappears fully or substantially offsets the cup unit premium before plastic taxes are applied.
In Markets with Plastic Charges: The Numbers Get Better
Plastic-specific charges differ by market. Spain taxes non-reusable plastic packaging at €0.45/kg (since January 2023), the UK (outside the EU) applies its Plastic Packaging Tax to plastic packaging components with less than 30 percent recycled plastic (£228.82 per tonne from 1 April 2026), and in Germany producers of single-use plastic cups and lids pay into the Single-Use Plastics Fund. Italy’s plastic tax has been postponed to 2027, and France uses eco-modulated EPR fees instead. Eliminating the plastic lid eliminates these lid charges entirely. In Spain at €0.45/kg, a 5g plastic lid carries about €0.0023 in plastic tax — at 4,000 lids per month, about €9.20 per month in plastic tax that disappears with lid-free cups. Added to the lid purchase cost you no longer pay, this tilts the net position in the Spanish market further in favor of the switch.
The Operational Saving Beyond Cost
Lid stock-outs halt service for all cups even when cup stock is adequate. A café running out of 12oz lids cannot serve 12oz drinks regardless of cup stock level. Converting to lid-free cups eliminates this operational risk entirely. The value of a stock-out prevention is difficult to quantify but is operationally material during peak service periods. See: Are Lid-Free Coffee Cups Worth It and lid-free hot cups.
Tactic 3: Consolidate to a Single Packaging Supplier
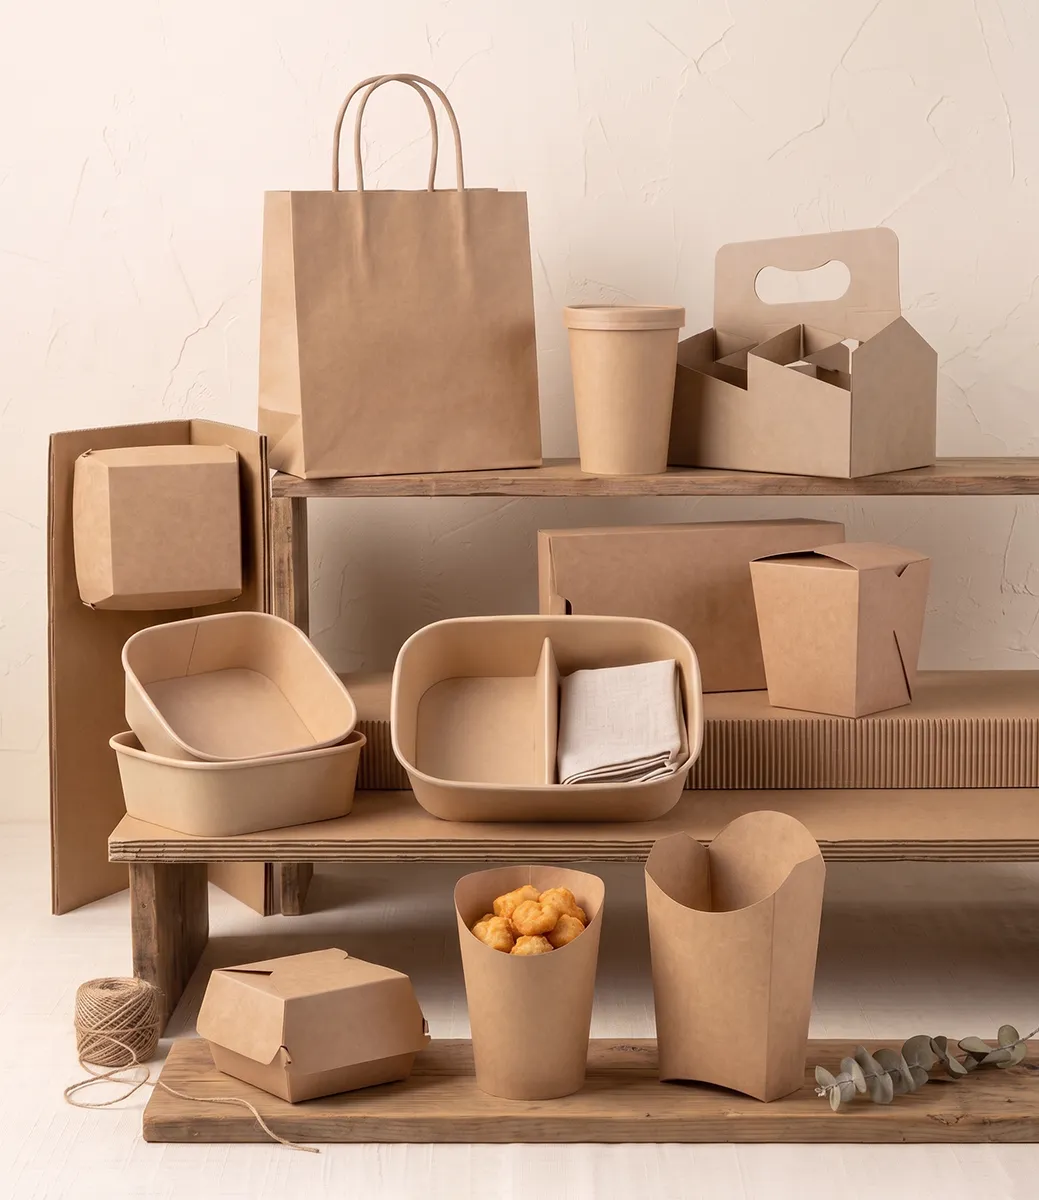
Multi-supplier packaging procurement is the norm in horeca operations that grew organically — cups from one supplier, containers from another, cutlery from a third, greaseproof paper from a fourth. Each supplier relationship seemed logical when it was added. The cumulative cost of maintaining four separate supplier relationships is rarely explicitly calculated.
The Hidden Cost of Multi-Supplier Procurement
- Volume fragmentation: your cups spend with supplier A and your container spend with supplier B means neither supplier sees your full packaging volume. Full volume consolidation to one supplier typically qualifies you for a better pricing tier on all products than you achieve with split volume.
- Freight cost per order: four separate supplier shipments incur four freight charges. A single consolidated shipment of the same total volume incurs one — so the monthly freight bill falls roughly in proportion to the number of shipments removed.
- Procurement time: four suppliers require four sets of: price negotiations, order placements, delivery tracking, invoice processing, quality issue management. At 2 to 3 hours per supplier per month for these activities, four suppliers cost 8 to 12 hours of management time per month versus 2 to 3 hours for one supplier — time with a real labor cost.
- Documentation fragmentation: for EU compliance and for substantiating environmental claims under Directive (EU) 2024/825, four suppliers mean four sets of certification documentation to manage, verify and keep current. Single-supplier procurement means one documentation portfolio — which is also significantly easier to provide to corporate accounts and procurement teams that require it.
How to Execute the Consolidation
Identify your current packaging spend by supplier. Request a consolidated quote from your highest-volume supplier covering your full packaging range — most direct suppliers can cover cups, containers, lids, cutlery and greaseproof paper from a single source. Compare the consolidated quote against your current fragmented spend including freight and procurement time cost. In most cases, consolidated procurement delivers savings on total spend through volume pricing, plus a substantial reduction in freight and procurement overhead. See: How to Choose a Food Packaging Supplier for EU Markets and Horeca Packaging Procurement Guide.
Tactic 4: Fix the Delivery Packaging Failure Rate
Delivery packaging failures — leakage, structural collapse, condensation damage — cost money directly through refunds and replacements, and money indirectly through lost repeat orders and damaged platform ratings. These costs do not appear in the packaging budget. They appear in the customer service budget, the refund line and the revenue from delivery platform orders. This is why they are systematically underestimated in packaging cost analysis.
Calculating Your Current Failure Cost
Review your last 90 days of delivery order data. How many orders received packaging-related complaints or refunds? Assign the average order value to each as the refund cost. Multiply by 12 for annual run rate. As an illustration, for a restaurant with 80 delivery orders per day, average order value €20, and a 2.5 percent packaging failure rate:
- Daily failure cost: 80 × 0.025 × €20 = €40
- Monthly: €1,200
- Annual: €14,400
This does not include the non-reorder effect: customers who experience a packaging failure and do not reorder. A meaningful share of customers who have a packaging-related negative experience do not reorder from that operation. For a restaurant with 200 unique delivery customers per month, a 2.5 percent failure rate affects 5 customers per month — and if 2 of them do not come back, they are lost permanently. At €20 average order value and 2 orders per month per customer, each lost customer represents €40 per month in permanent revenue loss. Five months of packaging failures losing 2 customers per month = 10 permanently lost customers = €400 per month in permanent revenue reduction.
The Fix and Its Cost
Better delivery packaging — specifically: bagasse containers with matched fiber lids providing positive snap-fit rather than resting-fit lids, PFAS-free greaseproof paper for burgers and sandwiches rather than sealed containers, and maximum 75 to 80 percent fill level enforcement — can substantially reduce delivery failure rates. Higher-performance formats carry a higher unit price than basic containers; the difference depends on format, volume and print, and is quoted per project. Set that against the €14,400 per year lost to failures in this example, plus permanent customer losses, and the upgrade typically pays back strongly. See: Food Delivery Packaging Mistakes and bagasse food containers.
Tactic 5: Plan MOQ Against Actual Consumption to Eliminate Dead Stock
Dead stock — packaging you have ordered and cannot use before it deteriorates, becomes obsolete or simply occupies storage space indefinitely — is a direct write-off of packaging spend. It is surprisingly common in horeca operations where menu changes, seasonal shifts and format consolidation decisions leave excess stock of formats that are no longer used at the rate they were ordered.
How Dead Stock Accumulates
- A container format is consolidated — the replacement is ordered at full MOQ before the existing stock is fully consumed
- A seasonal menu item is discontinued — the dedicated container for that item has 3,000 units remaining in stock
- A cup size is retired from the menu — 2,000 units remain in stock
- A private label order arrives — the previous plain format stock has not been fully consumed
For an operation managing eight packaging SKUs, one or two dead-stock events per year at 2,000 to 3,000 units each is a direct write-off of packaging spend — before the storage cost of the excess stock.
The Practical Fix
Before placing any packaging order, calculate the specific working order quantity for that SKU based on actual consumption rate, lead time and desired buffer stock. The formula: (monthly consumption × reorder cycle weeks / 4) + (monthly consumption × buffer weeks / 4). Order to this number, not to MOQ. If the working order quantity is below MOQ, accept the MOQ and carry more buffer stock — but plan the reorder cycle so the next order happens when you actually need it, not on a fixed calendar cycle that ignores actual consumption rate.
For format changes and consolidations: complete a full consumption audit before switching formats. Calculate how many weeks of current format stock remain. Time the new format order to arrive when existing stock is at buffer level, not before. This prevents the dead-stock accumulation that format switches routinely create when not managed against actual consumption data. For the complete MOQ management framework, see: MOQ in the Packaging Industry.
The Sequence: Where to Start
These five tactics are not equally urgent for every operation. Implement them in this sequence based on your specific situation:
- If you are losing money on delivery failures: start with Tactic 4. The monthly cost of packaging failures typically exceeds the cost of all other packaging inefficiencies combined for delivery-heavy operations. Fix this first.
- If you have five or more container SKUs: start with Tactic 1. SKU proliferation is the most common source of unnecessary packaging cost and the easiest to address without changing formats.
- If you operate in a market with plastic-specific charges and use separate plastic lids: start with Tactic 2. The combined saving from lid cost elimination and plastic tax reduction often covers the cup format transition cost quickly.
- If you are sourcing from three or more suppliers: start with Tactic 3. Supplier consolidation produces savings across all SKUs simultaneously and simplifies implementation of all other tactics.
- If you have experienced dead stock write-offs in the past 12 months: start with Tactic 5. One dead-stock prevention is worth multiple reorder cycle optimizations in cash flow impact.
For most operations, implementing all five tactics over 12 months produces substantial total packaging cost savings — primarily through operational efficiency rather than format cost reduction.
Reduce Packaging Costs with Direct Wholesale Supply
Ekoroll supplies complete packaging systems wholesale to horeca operators and distributors across Europe. Single supplier for cups, containers, lids, cutlery and greaseproof paper — consolidated procurement, one documentation portfolio, direct pricing quoted per project. Explore our packaging range or contact us with your current packaging range and volumes for a consolidated cost comparison.